


PROFESSIONALCOMMUNITY
Task Logger
-
Last updated: July 6, 2023
-
Read time: 1 Minute
You can examine traffic generated for a single task. This enables you to investigate a task that behaves unexpectedly, or monitor the progress of a specific task.
To view task-specific log entries:
- Go to Dashboard, and scroll down to the relevant task in the Tasks field.
- Click on the View details icon for the task. A window opens with details of the task.
- Select the Logger tab in the task window.
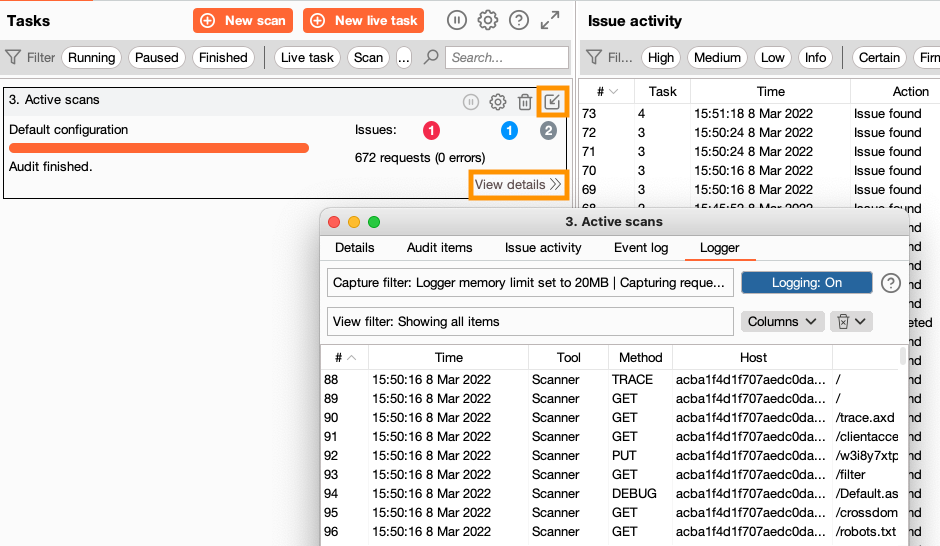
The task-specific Logger functions in a similar way to Burp Logger, with a couple of notable differences:
- The default memory allocation for each task is only 10MB, or 20MB if you give Burp Suite access to 1GB or more of memory.
- You cannot capture or filter by tool, as the task-specific Logger only captures and displays traffic from the tool used for the task.
Related pages
For information on how to edit what the task-specific Logger captures and displays, including memory allocation, see Burp Logger settings.